
Glossary » Graphic Design
negative space
the space surrounding foreground elements; the background or whitespace. In graphic design theory, the shape of the negative space needs to be aesthetically pleasing to form a balanced composition. In certain types of layouts, the negative space may be just…
Read more »NOIR
nominal-ordinal-interval-ratio. A mnemonic for remembering common data scales used in empirical measurement.
Nominal – a set of items that can be distinguished by name or category. Ordinal – items that can be ordered, such as military rank, or units of…
Read more »OCR
optical character recognition; using image recognition techniques so that a computer can convert an image of text (from a scan or photograph) to the computer-readable alphanumeric representation of that text. The challenge to successful OCR is in correctly interpreting the…
Read more »perspective wall
a way of densely displaying large amounts of information by placing information on a flat plane which is tilted into the screen so that it shrinks back toward infinity. More important items (such as upcoming dates on a calendar) can…
Read more »PERT chart
(Program Evaluation and Review Technique) a type of flowchart used in project management, where each task is represented by a node and connected to other tasks with arrows to indicate task dependencies. Each node may be labeled with necessary resources…
Read more »physical integration
when items that have to be compared are side by side on the screen so people can see both things simultaneously and not have to remember something from a previous page or have to scroll up or down to find…
Read more »portrait and landscape
describes the orientation of a rectangle, a screen, a printout, or any image with unequal length and height. A portrait orientation is taller than it is wide, as would be common for a portrait in a photograph. A landscape orientation…
Read more »readability
the degree to which the meaning of text is accessible, based on the complexity of sentences and the difficulty of the vocabulary that is used. Readability indexes usually rank usability by the age or grade level required for someone to…
Read more »redundant coding
or secondary coding; representing information in more than one way so that users have more than one opportunity to perceive and understand it, to reinforce the information, to make the information more accessible (because one representation may not work for…
Read more »RGB
red-green-blue; a common color model used especially in CRTs which specifies any given color as a combination of 3 brightness values for red, green, and blue elements. While theoretically equivalent to other color models (HSV, HSB, CMYK), the RGB makes…
Read more »rough
(graphic design) a rapidly-drawn sketch, larger and more detailed than a thumbnail sketch, but less refined and precise than a comp, used to explore visual possibilities in design.
Read more »SAFE
simplicity, appropriate form, function (workability & beauty), economy of effort. SAFE design principles were the organizing principle of the modern design book “art: an approach”, by Robert C. Niece, 1959.
Read more »schedule chart
a diagram used in project management, planning, and scheduling. The schedule chart shows the different resources and activities involved in a project and time dependencies between them. With this diagram, a critical path can be found that indicates the shortest…
Read more »scientific visualization
the graphical representation of complex physical phenomena in order to assist scientific investigation and to make inferences that aren’t apparent in numerical form. Typical examples include processing of satellite photographs and 3D representations of molecules and fluids to examine their…
Read more »screen font
a font designed for legibility when displayed on a computer screen (or, for example, on a television screen) as opposed to a “printer font”, which is optimized for printing. Screen fonts need to be designed for clarity on the relatively…
Read more »screen real estate
the amount of space available on a display for an application to provide output. Typically, the effective use of screen real estate is one of the most difficult design challenges because of the desire to have as much data and…
Read more »semiotics
the study of signs and symbols and their use in communicating meaning, especially useful in analyzing the use of icons in software, but also appropriate to the analysis of how screen design as a whole communicates, and to how users…
Read more »shared whiteboard
allows two or more people to view and draw on a shared drawing surface even when they’re at a distance. This may be used, for instance, during a phone call, where each person can jot down notes (e.g. a name,…
Read more »skins
alternative look and feel for the same application that can be swapped by the user, especially window styles and button styles, enabling highly personalized artistic styles in the user interface. Sometimes called chrome.
Read more »sociogram
a diagram that shows interaction patterns between people; for instance, a diagram with a node to represent each individual and lines drawn between individuals to indicate that they interact frequently. These diagrams can be used to study workflows, the clustering…
Read more »spot graphic
an image used as an illustration or decoration on a page or on the screen, generally without a functional purpose other than its visual appeal and dynamics within a layout.
Read more »squint test
evaluating a graphic layout by squinting your eyes. This tests legibility and whether the overall layout is a strong, clear layout.
Read more »starfield display
a refinement of a scatter diagram used in information visualization. A starfield display charts a large number of datapoints with individual points representing records in a database. The individual points can be represented as simple shapes and colors, but may…
Read more »state machine diagram
a visual representation of a series of “states” and transitions between those states, useful for modeling a wide variety of simple programming problems. Also called a “state transition diagram” or “transition network”.
Read more »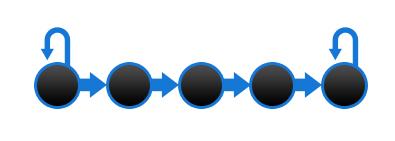
storyboard
a series of illustrations that represent a process, such as the steps of interacting with a computer or frames from an animation or movie. Storyboards are useful for presentations, such as with focus groups, and for checking that the steps…
Read more »